Compiled by: Investintech – PDF to Excel
Recent Posts
- Avoid the “Kong Effect”
- Sleep Better Easier with ABCVs
- Misunderstanding Medication
- The UX of Perception
- What is your Plan B for COVID-19?
- Texts from inside a Costco Pandemic
- How to use jQuery on your site
- Google Wants You to Tell it a Story
- How to be more successful
- Ten Greatest Chess Players of All Time
- Google lies to you because they want to help you.
- How Can the Valsalva Maneuver End Even EXTREME Pain?
- Why Hasn’t Anyone Solved This Huge Time Tracking Problem Yet?
- The Not-All-That-Important Higgs Bosun Particle
- Scrivener Keyboard Shortcuts For Windows—The Complete List for v1.2.1.0
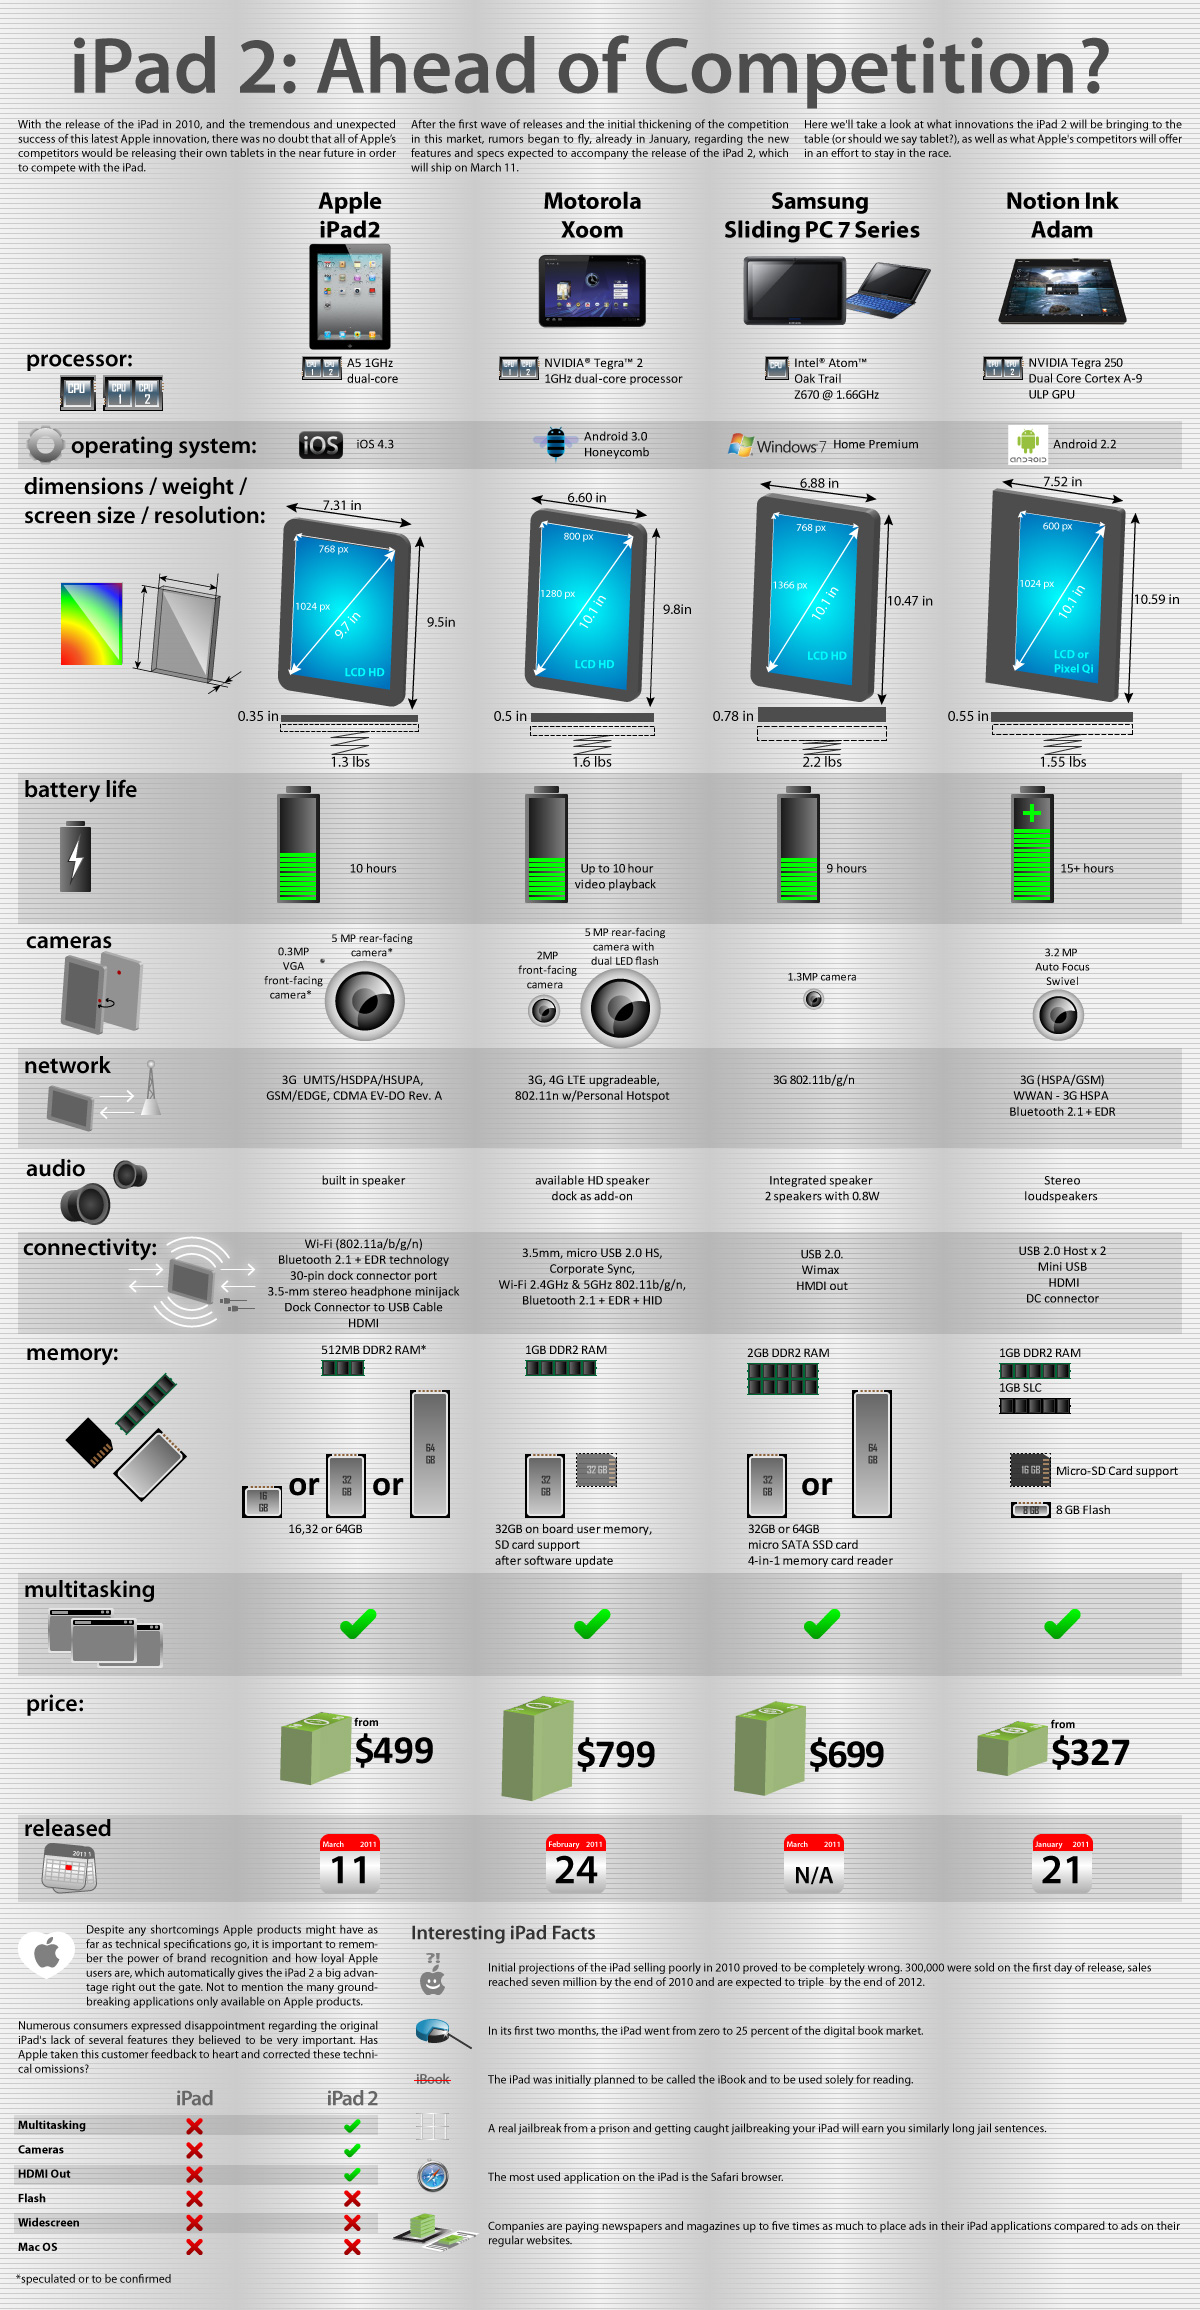
The most significant difference and the one that most affects usability is the operating system and the apps – as Clark pointed out in March.
Another difference, and the one that most affects sales, is the Cool rating.
And the “cool rating” is amplified by the skill of the company marketing it 🙂
Do you still rate hardware based on a spec sheet alone? This graph has little practical purpose when the user experience with software et al is given no consideration.
Agreed.